
Google Chrome is one of the Most Popular Browsers when it comes to features, usability, and simplicity. But there are still some cool things you can do with Google chrome.
What is Chrome Dev Tools
Like any other browsers, chrome also has an inbuilt debugging system and it is called Chrome Devtools. Where developers and advanced users can play with the code, inspect the elements and catch the errors.
To Launch Developer Tools in Chrome, Press F12 or Ctrl + Shift + I in Windows and Cmd + Shift + I in Mac
Do You Know: You can’t post on Instagram from Computer. Here is the trick to Post on instgram from PC
Preview in Device Toolbar
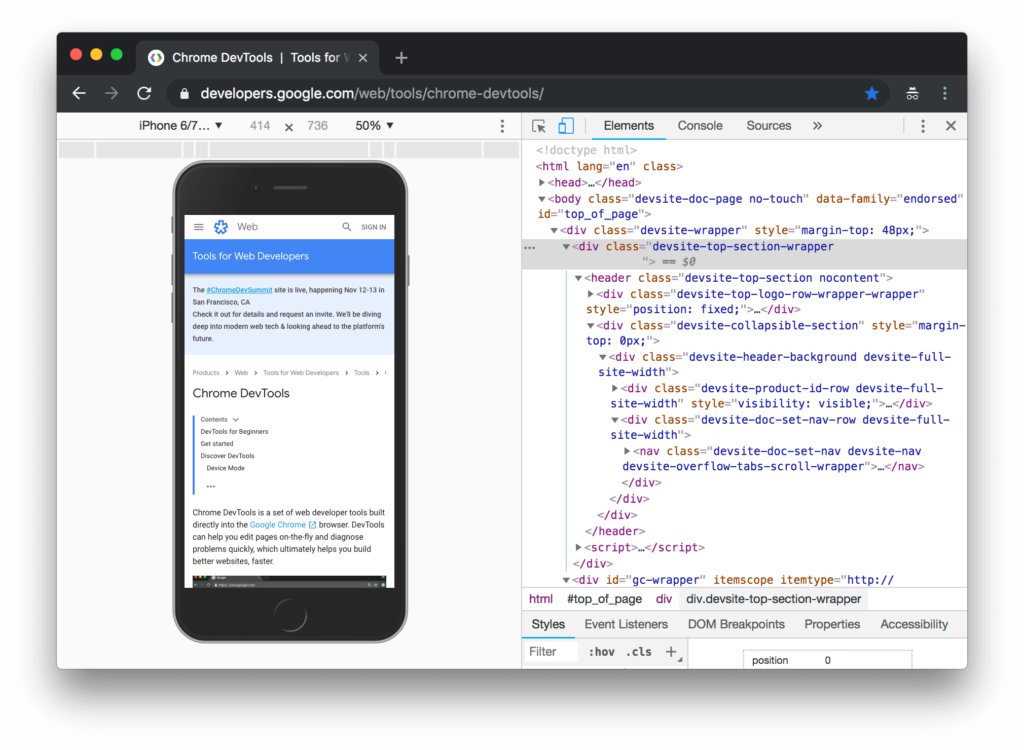
Being a web developer, you might want to test your webpage on different screen sizes . Here, you gotta list of Devices from Mobile to a laptop of different screen sizes. You can check the layout of any website on different screen sizes.
Inspect Elements live Editing
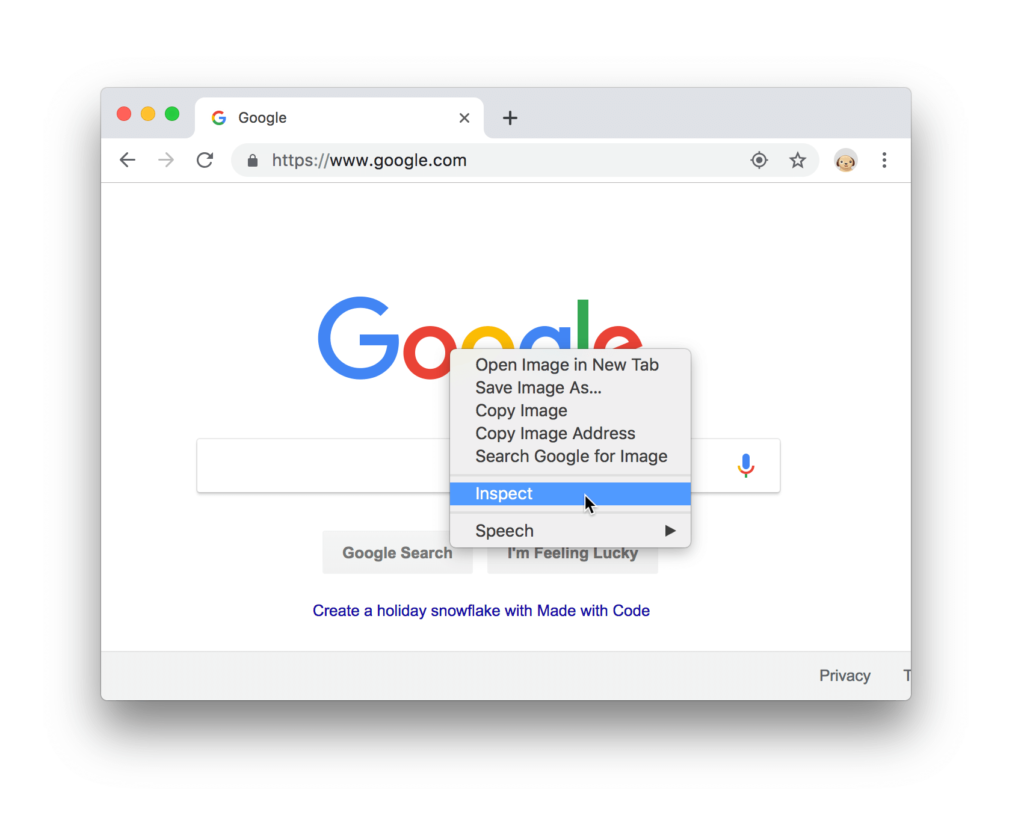
You Can inspect elements like any button or a link, and quickly edit them on the go to see the changes. Apart from the elements, it also shows the styles applied to that element. And you can edit or add your new CSS styles there.
Console for Errors
The Next Tab is the console tab. You can check the errors if any and warning related to that page.
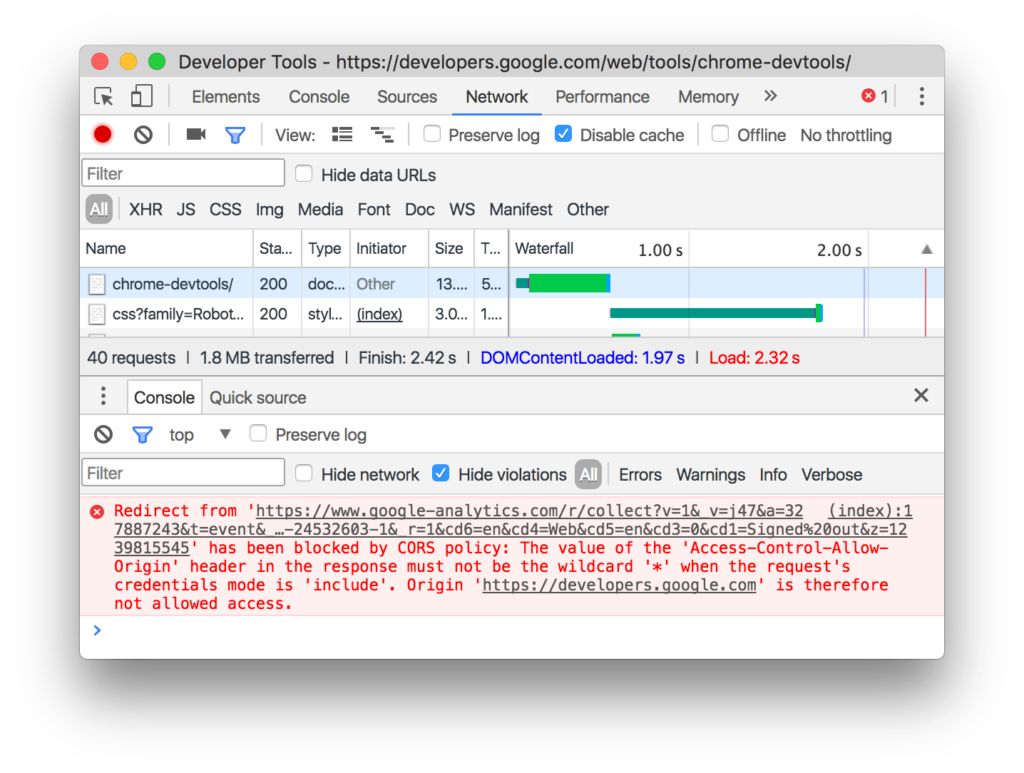
See all Resources in the Network Tab
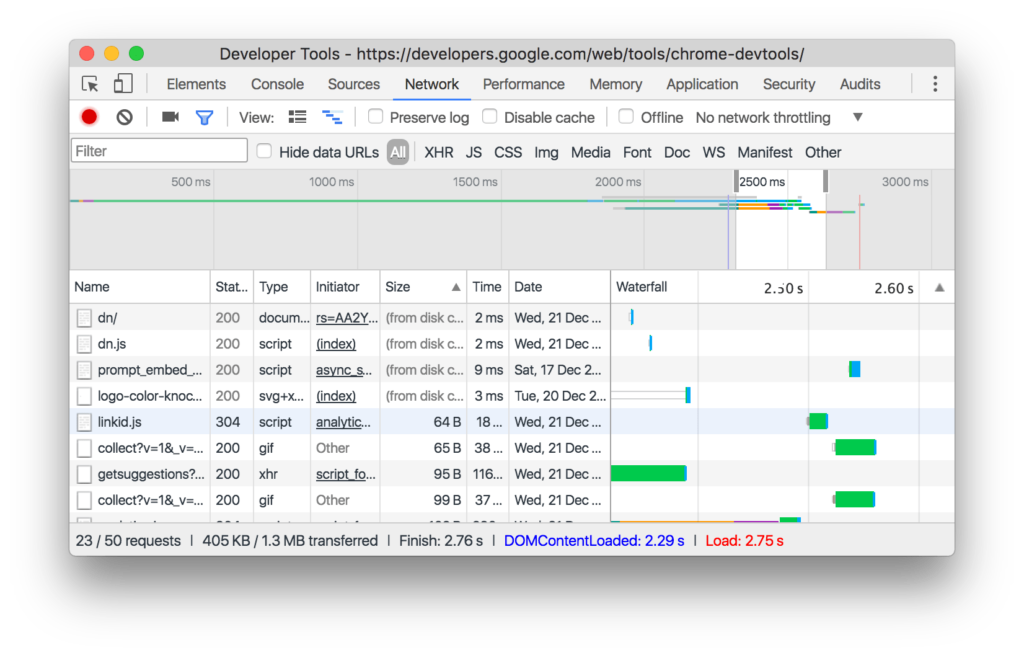
The Network tab shows all the resources included on that page. It may be CSS files, images, js files, fonts, manifest or other.
There is a detailed view of each resource with its size, time taken to load it. And in the waterfall section, you can see the loading sequence of all the elements.
You can set network preferences like Online, Fast 3G, Slow 3G, etc. There is also an option to disable browser cache in this section right above the waterfall table.
Perform Site Audit with Lighthouse
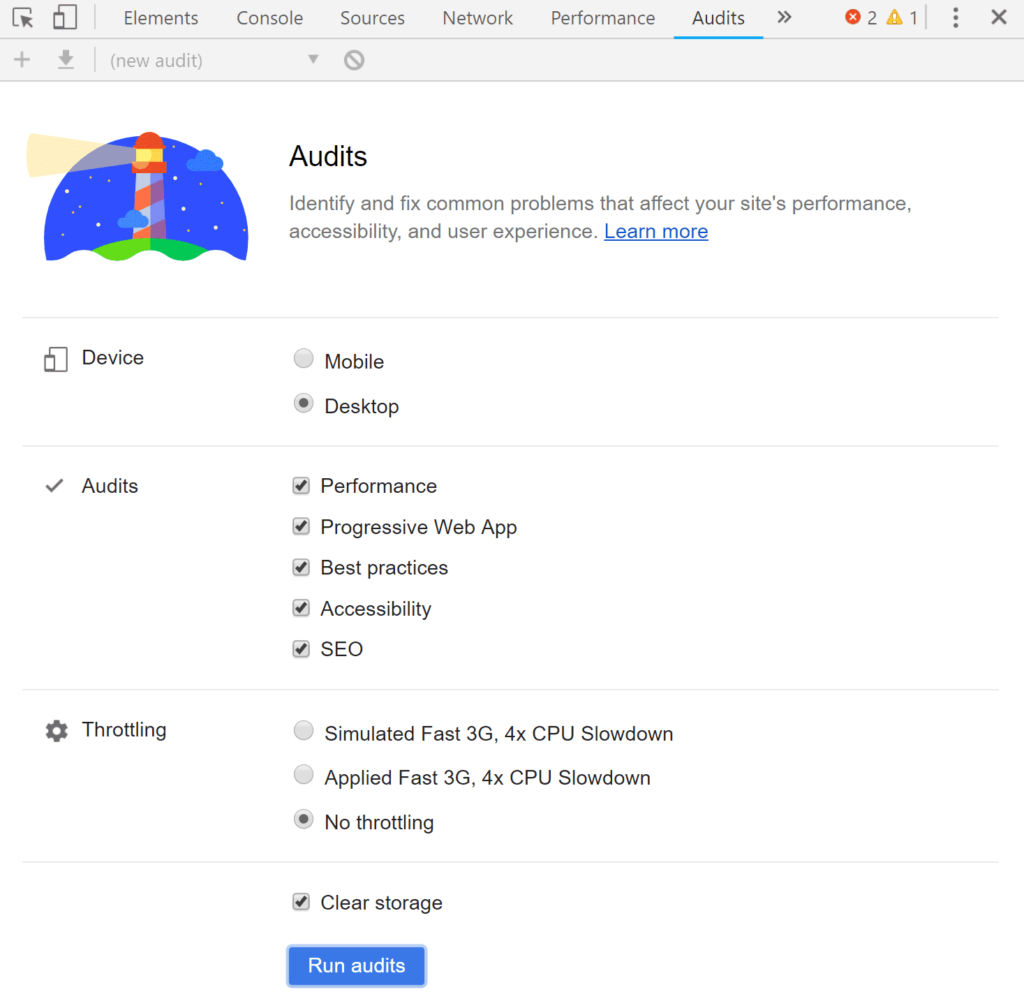
Chrome now has a built-in option to run a site audit of the given page on various metrics. It takes almost a minute or two and presents all the detailed audit reports on performance, SEO, errors and warnings, and scopes of improvement on that page.

